Hot Products





Popular articles
When foreign trade companies evaluate GEO service providers, how can they verify the construction actions and actual results in their client case studies?
拿到几家外贸GEO公司的报价,如何按相同服务范围逐项比较?
How to Validate Global GEO Source Development: From Channel Publication to AI Answers and Qualified Inquiries
感恩节 B2B 独立站 GEO 落地页优化:让北美不同区域采购商进来就想发询盘
感恩节客户放假,询盘如何不断档?外贸官网的假期承接清单
Recommended Reading




Authoritative Outlook: Which Industries Will Drive Global Trade Growth in 2027?
How can businesses assess foreign trade opportunities in 2027? ABKE examines demand, market access, costs and business risks across six sectors: AI infrastructure, power grid upgrades, renewable energy, industrial automation, metals and materials, and agriculture and food. This helps B2B exporters build a framework for evaluating products, countries and customers, and plan multilingual content and overseas channel strategies.
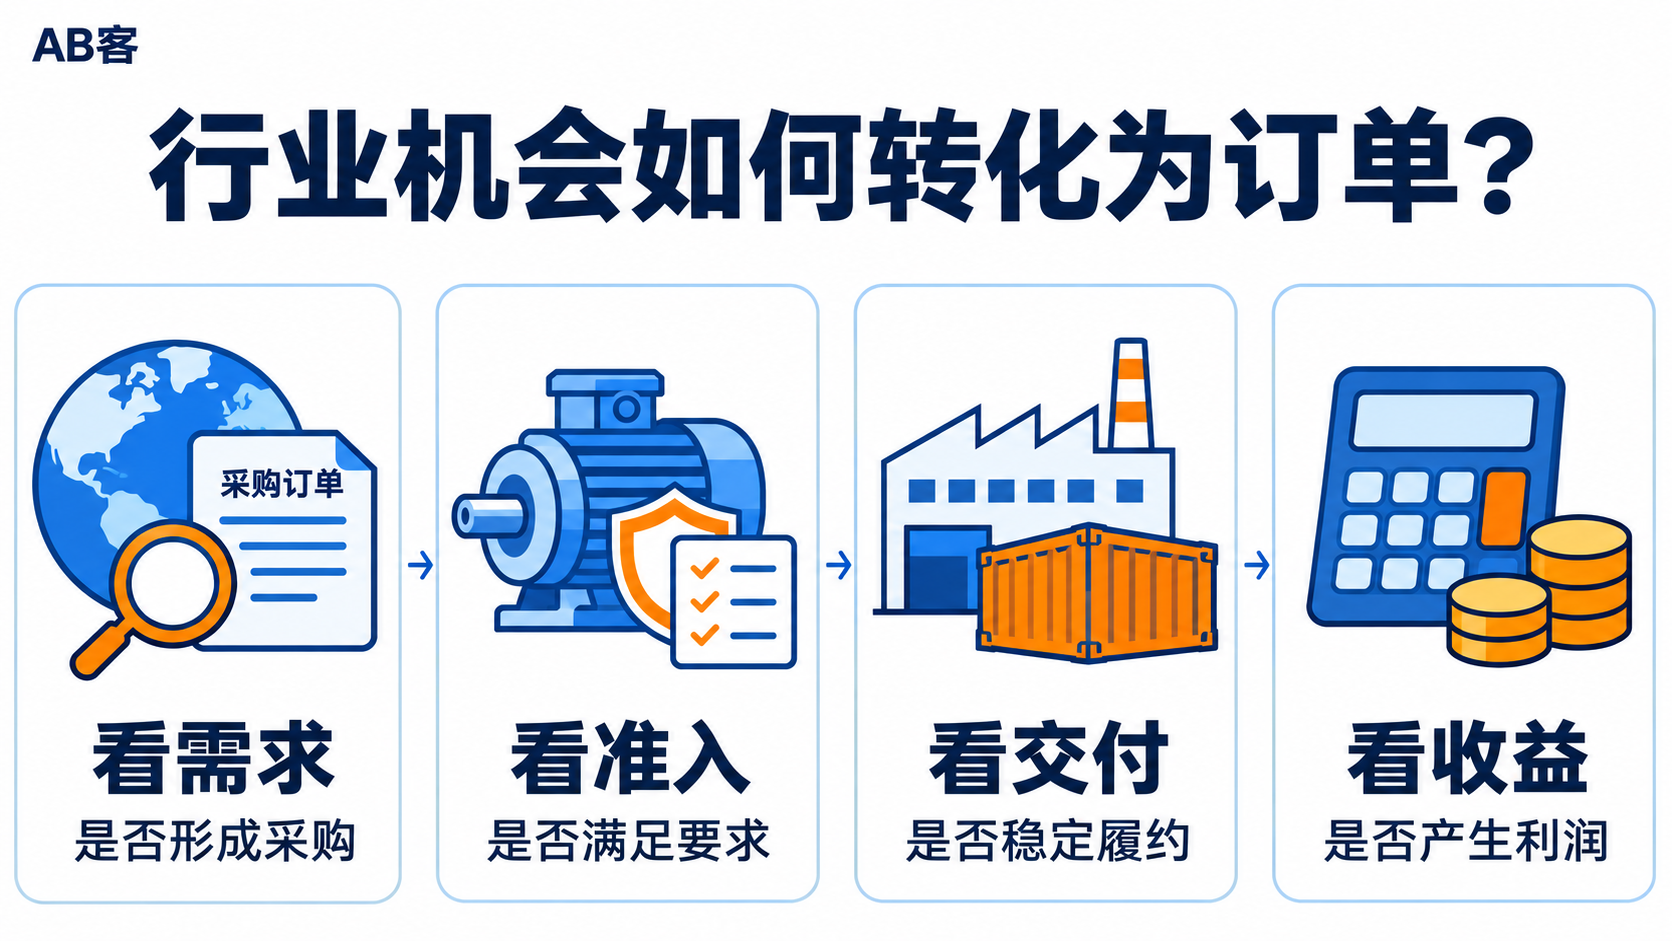
Foreign trade opportunities in 2027 are more suitable from...Specific products, target countries and procurement scenariosThe assessment should focus on factors beyond just global trade volume. AI infrastructure, electrification, renewable energy, industrial automation, metallic materials, and agri-food warrant continued observation, but whether demand growth translates into orders for Chinese suppliers depends on import demand, market access, delivery capabilities, and operating profitability.
I. Global Trade Outlook for 2027: What Structural Changes Lie Behind the Overall Forecast?
1. What do global economic and trade forecasts respectively indicate?
Global GDP measures economic value added, merchandise trade volume reflects the actual flow of goods across borders, and trade in services covers transportation, travel, and other services. These three metrics differ in their statistical objects, price treatments, and industry weights, and cannot be substituted for one another.
| index | 2026 forecast | 2027 forecast | Use boundaries |
|---|---|---|---|
| WTO Global Merchandise Trade Growth | 3.9% | 4.1% | Global trade volume is not equal to China's export value. |
| WTO growth rate of trade in services | 3.3% | 6.4% | It cannot replace manufacturing order indicators |
| IMF Global Economic Growth | 3.1% | 3.4% | Industry sales cannot be directly estimated |
The references cite the WTO and IMF's October 2026 outlook; however, verification with the original sources is required. Forecasts typically rely on assumptions regarding geopolitical situations, investment, and supply chains; businesses should distinguish between "projected growth" and "actual growth" and monitor subsequent revisions.
2. Why does an increase in export value not necessarily mean a corresponding increase in order volume?
The reference data shows that in the first half of 2026, global merchandise trade value increased by approximately 15% year-on-year in US dollar terms, while trade volume increased by approximately 3.5%. This set of WTO data still needs to be verified against the original table. The difference between the two sets of data indicates that changes in value are simultaneously affected by quantity, price, exchange rate, and product structure. Rising prices of raw materials or electronic components may also increase export value.
Business decisions should simultaneously record order quantity, average selling price, gross profit margin, and cash inflows. An increased proportion of high-priced products does not necessarily indicate increased sales volume for all products; rising revenue may also be accompanied by longer payment terms and higher capital tied up in inventory.
3. What verifications are needed to identify industry opportunities in 2027?
-
Will final demand increase: from end-use or from short-term restocking?
-
Does cross-border procurement occur? Can local production meet the demand?
-
Do suppliers meet the entry and delivery requirements: Do their certifications, testing, capacity, and services match?
-
After deducting customer acquisition, fulfillment, and funding costs, is there still a reasonable profit?
II. Which industries are likely to support trade growth in 2027?
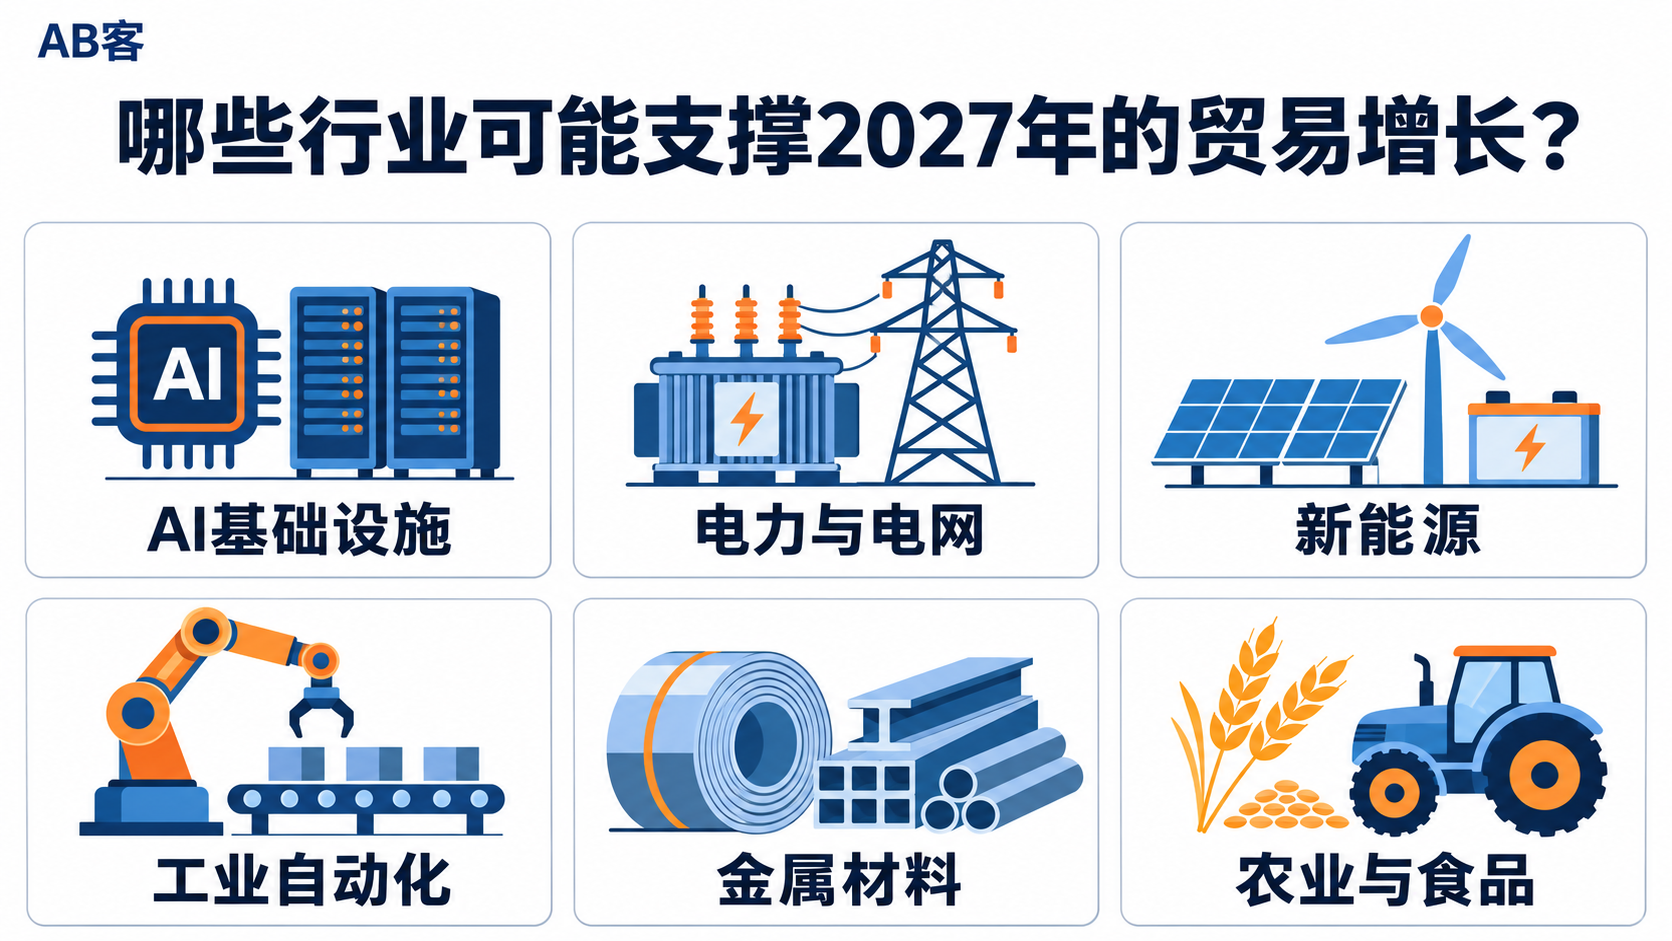
1. AI Infrastructure: How does demand flow from chips to manufacturing support?
The reference material states that AI-related products contributed 47% of the increase in global merchandise trade value in the first half of 2026; this is not its proportion of total trade. The material also lists Gartner's August 2026 forecast that global semiconductor revenue will reach approximately $1.94 trillion in 2027, including memory price factors. Both figures should be verified against the original source and the classification standards.
Demand may flow along the chip, server, interconnect, power supply, and heat dissipation lines to manufacturing components. Ordinary manufacturers should verify whether their components are included in the actual bill of materials and prepare evidence of performance, reliability, production capacity, and customer adoption. Core computing equipment and infrastructure components should not be confused with ordinary consumer electronics; semiconductor revenue growth does not necessarily mean that the entire electronics industry or Chinese suppliers will receive orders.
2. Electrification and Grid Upgrading: Where Does the Equipment Demand Come From?
The reference data shows that the IEA predicts global electricity demand will grow at an average annual rate of 3.6% from 2026 to 2030; to meet the demand in 2030, annual grid investment will need to increase by about 50% from the existing $400 billion. The latter is a judgment on system investment needs, not a single-year procurement forecast for 2027.
Industrial electricity consumption, data center electricity consumption, transportation electrification, and building electricity consumption will create different capacity and reliability requirements. Suppliers of transformers, switchgear, cables, power electronics, and monitoring and control systems should track project planning, bidding, access, testing, and delivery dates, rather than simply expanding production based on the rate of increase in electricity consumption.
3. Renewable Energy: How does installed capacity growth translate into equipment trade?
According to IEA forecasts cited in the references, the cumulative new installed capacity of renewable energy worldwide will exceed 4770GW from 2026 to 2031, with photovoltaics accounting for about three-quarters. The cumulative installed capacity over many years cannot be used to calculate the market size in 2027, nor can it directly represent export profits.
Centralized power plants, industrial and commercial distributed projects, and residential distributed projects differ significantly in financing, procurement entities, and after-sales service. Component, inverter, bracket, energy storage, and system integration companies should separately verify grid connection, consumption, channel inventory, and local service conditions. Installed capacity expansion can occur simultaneously with capacity competition and product price reductions.
4. Industrial Automation: How does manufacturing investment lead to the procurement of equipment and components?
According to IFR data cited in the references, over 600,000 new industrial robots were installed globally in 2025, representing an 11% year-on-year increase; the figure is projected to reach approximately 655,000 units in 2026. These figures need to be verified and cannot be extrapolated to 2027 sales.
For automotive, electronics, metal processing, and logistics applications, a distinction should be made between equipment upgrades, production line modifications, and new factory construction. The procurement of control, sensing, execution, vision, and integration components ultimately depends on cycle time, yield, downtime, maintenance costs, and payback period. Quotations should clearly specify acceptance conditions, interfaces, and on-site service responsibilities.
5. Metallic Materials: Will the recovery in demand create export opportunities?
The reference data attributes the 1.7% growth in global steel demand to 1.752 billion tons in 2027, and the 4.0% growth in demand outside of China, to Worldsteel's October 2026 forecast. Please refer to the original table for details.
Materials used in infrastructure, non-residential buildings, machinery, electrical systems, and automobiles cannot be explained by the same cycle. Basic materials, processed products, and high-value-added components also face different types of competition. Companies should compare regional demand with local supply expansion and verify trade remedies, product standards, and emissions data requirements. Increased demand for materials does not equate to increased imports, much less an increase in China's export share.
6. Agriculture and Food: How will long-term demand influence purchasing choices in 2027?
The references show that the OECD and FAO predict that global GDP covering agricultural products will grow by 13.3% in constant US dollars by 2035 compared to the base period, with relevant middle-income economies contributing the majority of the increase. Ten-year forecasts only indicate structural direction and cannot serve as a basis for predicting the 2027 growth rate.
The procurement logic differs for grains, livestock products, aquatic products, and processed foods. Increased productivity may drive demand for agricultural machinery, irrigation, processing, packaging, and cold chain equipment, but equipment exports are still limited by farm size, financing, maintenance, and distribution capabilities; food exports, on the other hand, require accounting for raw materials, testing, shelf life, losses, and stable delivery.
III. Why do different industries diverge in different markets?
1. Are markets with faster demand growth necessarily more suitable for entry?
References show that the IEA predicts average annual growth rates of electricity demand in India and Southeast Asia of 6.4% and 5.3% respectively from 2026 to 2030; Worldsteel predicts that India's steel demand will grow by 8.0% in 2027. These industry indicators still need to be verified and cannot replace product-level import data.
High-growth markets may simultaneously present challenges such as local capacity expansion, certification hurdles, channel control, and payment risks. New projects, equipment upgrades, and the aftermarket should be assessed separately; projects with demand but lacking financing or installation services may not generate orders in a timely manner.
2. How to establish a judgment matrix of "product-country-customer type"?
| Judgment Dimensions | Information that needs to be verified |
|---|---|
| Product requirements | Specific applications, procurement volume, and alternative solutions |
| Market Access | Product standards, certification and import requirements |
| competitive conditions | Local supply, international competitors and landed costs |
| Customer Structure | OEMs, integrators, distributors or end users |
| Operating conditions | Payment, delivery, installation, after-sales service and capital occupation |
Each group should have its own record of the evidence date and responsible person. Within the same country, different products and customer groups may be in different procurement cycles, so budgets cannot be allocated solely based on national popularity.
IV. How will cost changes affect orders and profits in 2027?
1. Why do commodity price forecasts show different directions?
| World Bank Commodity Index | Year-on-year forecast for 2027 | Analysis of foreign trade operations |
|---|---|---|
| energy | −11.5% | Operating costs, raw materials and transportation expenses |
| Metals and Minerals | −3.3% | Material procurement, inventory and quotation |
| food | +7.2% | Food processing costs and procurement arrangements |
| fertilizer | −12.4% | Inventory, farming season and order pricing |
The reference materials cite the World Bank's October 2026 report, using nominal US dollar annual averages as the benchmark. The forecast tables must be verified. The direction may differ depending on the commodity, region, and point in time of purchase; the reference index is not the company's procurement cost, nor is it the export transaction price, and a decline in the annual average price does not necessarily indicate a continuous decline throughout the year.
2. Why does a decrease in raw material prices not necessarily lead to improved profits?
-
High-priced inventory has not yet been sold off, and the selling price of new orders may have already been reduced by customers.
-
Customer bargaining, competitive pricing, and exchange rate fluctuations may offset material savings.
-
Shipping, insurance, after-sales service, and payment terms costs may increase.
-
There is a time lag between revenue increases and cash collection; therefore, profits and cash flow must be observed separately.
| variable | Real enterprise data | Sensitivity accounting |
|---|---|---|
| raw material | Inventory cost, purchase price, unit consumption | Calculate the existing stock and newly purchased materials separately |
| Price | Net transaction price, discount | Comparing order contribution before and after price adjustment |
| logistics | Freight, insurance, and delivery terms | Recalculated based on route and scope of responsibility. |
| exchange rate | Quotation, settlement currency and exposure | Test changes in payment timing |
| payment terms | Prepayments, days of receivable, and cost of capital | Calculate the impact of delayed payment |
The estimated range is determined by the company's historical fluctuations and contract terms, without pre-setting a general profit increase.
V. How will the changes to market access in 2027 affect supplier competition?
1. Which announced nodes are worth including in the business plan in advance?
The following are the points listed in the reference materials. Actual implementation requires verification of the current text, revisions and transitional arrangements of EU regulations and cannot be directly used as compliance advice.
| field | Published nodes | Key points of the main text analysis |
|---|---|---|
| EU Machinery Regulations | The main provisions shall apply from January 20, 2027. | Product categories, technical documents, and delivery responsibilities |
| Battery Passport | The relevant battery categories will be implemented from February 18, 2027. | Category scope, data, identification and maintenance responsibilities |
| CBAM | The reference materials indicate that the deadline for the first annual filing and corresponding certificate payment is September 30, 2027. Please check the latest rules. | Import data, accounting, and responsibility handover for 2026 |
| EU CRA | The main obligations are applicable from December 11, 2027. | Networked product security, software maintenance and vulnerability handling |
2. How to distinguish between legal obligations, customer requirements, and company presentation materials?
Verify the applicable products, legally obligated entities, documents, and retention requirements.
Identify additional conditions imposed by contracts and supplier audits.
Official websites and manuals can aid understanding, but they cannot replace legal documents.
Test reports must specify the subjects and conditions; client information, trade secrets, and restricted data should be provided according to authorized permissions. Evidence preparation may affect project access, but regulatory implementation itself is not proof of increased demand.
VI. What risks could change the trade forecast for 2027?
1. Four types of variables that need to be continuously tracked
-
Investment variables:Whether AI and other capital expenditures will continue, and whether projects will be delayed.
-
Supply variables:Whether the supply of energy, raw materials and key components has been restored.
-
Trade variables:Have tariffs, trade remedies, rules of origin, and export controls changed?
-
Operational variables:Has customer financing, inventory, cash collection, and exchange rates deteriorated?
The reference materials list escalating conflicts, adjustments to AI expectations, trade tensions, and fiscal vulnerabilities as risks highlighted by the IMF; specific wording should be compared with the report. Businesses should identify risks at the customer, product, and cash flow levels, rather than remaining at the level of macroeconomic labels.
2. How do companies use scenario analysis?
| scene | Changes to be observed | Corporate Response |
|---|---|---|
| Baseline Scenario | Demand and supply generally evolve along the lines of institutional forecasts. | Order conversion verified by product and country |
| Improvement Scenario | Project acceleration, supply and logistics improvements | Check production capacity, delivery time, and customer onboarding capabilities. |
| Pressure scenario | Investment delays, rising costs or trade frictions | Adjusting inventory, pricing deadlines, and payment arrangements |
The three scenarios described are part of the analytical tools used in this article, not institutional predictions, and are not assigned probabilities of occurrence. Companies can use actual indicators such as project delays and overdue receivables to set their own adjustment triggers.
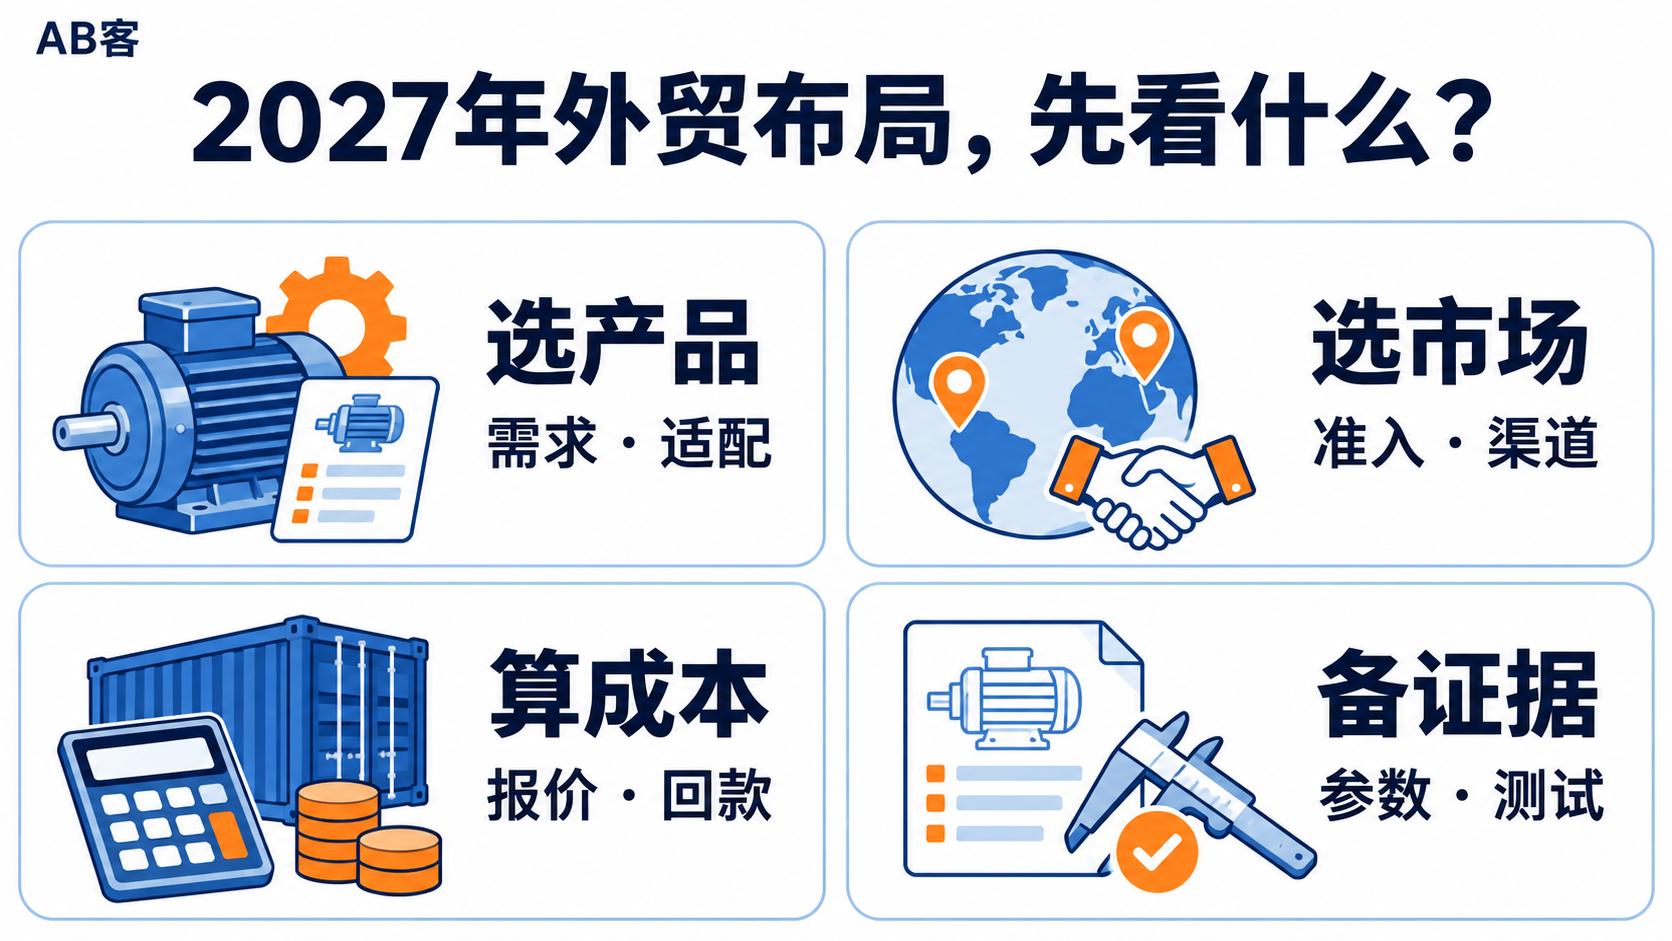
VII. How should Chinese foreign trade enterprises plan their product and market investments for 2027?
1. Configure product mix according to demand characteristics
-
Project investment-driven:Machinery, automation and power equipment; observe projects and capital expenditures.
-
System construction driven:Observe the overall construction progress by monitoring the energy system and infrastructure.
-
Raw material cycle driven:For metals, chemicals, and agricultural inputs, monitor inventory and price spreads.
-
Consumption and inventory drive:For textiles, home furnishings, and some consumer manufacturing, observe terminal sales and inventory replenishment.
-
Access and service-driven:Medical, connected devices, and high-requirement industrial products: observation, certification, and service conditions.
Classification is used to select indicators, rather than directly labeling an industry as growing or declining; the same product may also be affected by multiple factors.
2. Establish a verifiable business judgment form for key products.
| Fields | Required fields |
|---|---|
| Evidence required | Industry data, projects, customer purchase or import records |
| Target customers | Country, industry, role and procurement scenario |
| Product compatibility | Parameters, operating conditions, standards and usage limitations |
| Competition basis | Evidence of performance, quality, cost, delivery, or service |
| Business calculation | Gross profit, cash flow, capital occupation and after-sales costs |
| Adjustment conditions | Changes in input indicators that need to be adjusted |
Each entry retains its source, date, and applicable conditions, and customer feedback and internal assumptions are recorded separately to facilitate joint review by purchasing, sales, and finance departments.
3. What indicators need to be continuously monitored in 2027?
-
New investments in the industry and actual project implementation.
-
Changes in the import quantity, unit price, and supplier countries of the target product.
-
Customer inquiries, samples, review and order conversion.
-
Inventory, delivery time, returns, gross profit, and cash collection.
-
The actual progress of the application of policies and standards.
Transform macroeconomic observations into verifiable and adjustable business hypotheses: if demand evidence is insufficient, conduct further research; if technology is not well-suited, validate the product; if cash flow is insufficient, control the pace of expansion.
VIII. Frequently Asked Questions
1. Does the global trade growth in 2027 mean that Chinese foreign trade companies will generally see an increase in orders?
- That doesn't mean it. Global volume, national market share, product demand, and competitive conditions for companies are at different levels. Orders also depend on whether a specific customer makes a purchase and whether the supplier can pass the review.
2. With the growth of AI infrastructure, are there also opportunities for ordinary manufacturing companies?
- There may be opportunities for complementary products, but the actual supply chain relationships, customer onboarding, and testing conditions must be verified. The applicability of products related to heat dissipation, structural components, or power supply cannot be determined solely by their names.
3. Why do companies still struggle to secure orders despite rapid demand growth in emerging markets?
- Local competition, market access, financing, distribution channels, and after-sales service may limit entry. Payment guarantees, import conditions, and installation and maintenance responsibilities should be confirmed before assessing market attractiveness.
4. How to use long-term industry forecasts to identify opportunities in 2027?
- Long-term forecasts provide direction, but annual decisions still require verification from order, project, and import data. The cumulative increases over many years cannot be averaged out and directly used as the sales target for the following year.
5. In 2027, should foreign trade enterprises prioritize improving their product, market, or digital capabilities?
- There is no single answer. The order should be: evidence of demand, product compatibility, operating revenue, and information gaps. Digitalization is used to present and manage real capabilities, but it cannot replace product compliance and delivery.
9. Make a company's capabilities information that buyers can understand and verify.
After selecting a suitable industry and market, it's crucial to ensure buyers understand the company's capabilities. Product parameters, applicable operating conditions, testing requirements, case authorizations, qualification scope, and delivery responsibilities should be clearly defined and traceable, rather than relying on vague claims of strength.
AB KEAs a provider of a comprehensive GEO (Geographic Information Management) system for B2B foreign trade, its corporate knowledge base is used to unify facts, its multilingual website carries complete information, industry content answers purchasing questions, and inquiries are recorded and handed over to sales for follow-up. The role of its global content and channel network is to adapt this real-world knowledge to relevant channels and expand the reach of public information, rather than mechanically copying the same article to all platforms.
AB KE GEO Complete Process:
Products, technologies, case studies, qualifications
Official website, social media, industry platforms
Source, conditions, and fitting evidence
Demand recording and sales follow-up
The evaluation should record publication, inclusion, AI mentions or citations, valid inquiries, and business opportunities separately; one indicator should not be used as a substitute for another result. Third-party media adoption, search ranking, and AI recommendations are all determined by external mechanisms and cannot be guaranteed.
Enterprises canOne key product, one target market, and one set of real procurement questionsThe initial step involves assessing capabilities and identifying evidence gaps. ABKE, a brand under Shanghai Muker Network Technology Co., Ltd., offers GEO growth services centered around organizing content based on the company's authentic knowledge. Its "Global Content and Channel Network" provides channel planning, multilingual localization, brand factual consistency checks, release coordination, and performance reviews, and can integrate with the official website and inquiry management. During consultations, existing channels, target customers, and product information can be provided first, clarifying review responsibilities, account authorization, and delivery scope. The goal is to help search engines, AI, and buyers discover, understand, and verify company information, without guaranteeing rankings, citations, recommendations, or inquiry results.
The references for the predictions mentioned in the article are as follows:
- WTO: Global Trade Outlook and Statistics, references are updated in October 2026.
- IMF: World Economic Outlook, referenced as October 2026 edition.
- World Bank: Commodity Markets Outlook, references are for the October 2026 edition and forecast tables.
- IEA: Electricity 2026 and Renewables 2026.
- OECD and FAO: Agricultural Outlook 2026–2035.
- IFR: Official information released for World Robotics 2026.
- worldsteel: Short Range Outlook October 2026.
- Gartner: The reference material is a semiconductor market forecast for August 2026.
- European Commission and EU official legal texts: Machinery Regulation, Battery Passport, CBAM and CRA implementation documents.


