.png?x-oss-process=image/resize,h_100,m_lfit/format,webp)

.png?x-oss-process=image/resize,m_lfit,w_200/format,webp)

Hot Products

.png?x-oss-process=image/resize,h_2000,m_lfit/format,webp)

.png?x-oss-process=image/resize,h_2000,m_lfit/format,webp)

Popular articles
Are More Multilingual Websites Always Better? Why Some Companies Confuse AI
How to Set GEO Evaluation Baselines, Monitoring Cycles, and Review Cadence for Export B2B in Q4 2026
Q4 2026: How to Sample-Check AI Answers for Accurate Product Capability and Technical Boundary Statements
AI Recommended Your Business but You Got No Inquiries—What Is GEO Really Worth?
What GEO Optimization Trends and Directions Matter Most in Q4 2026?
Recommended Reading



How to Build a Q4 2026 GEO Multi-Stage Evaluation Dashboard and Management Report Template
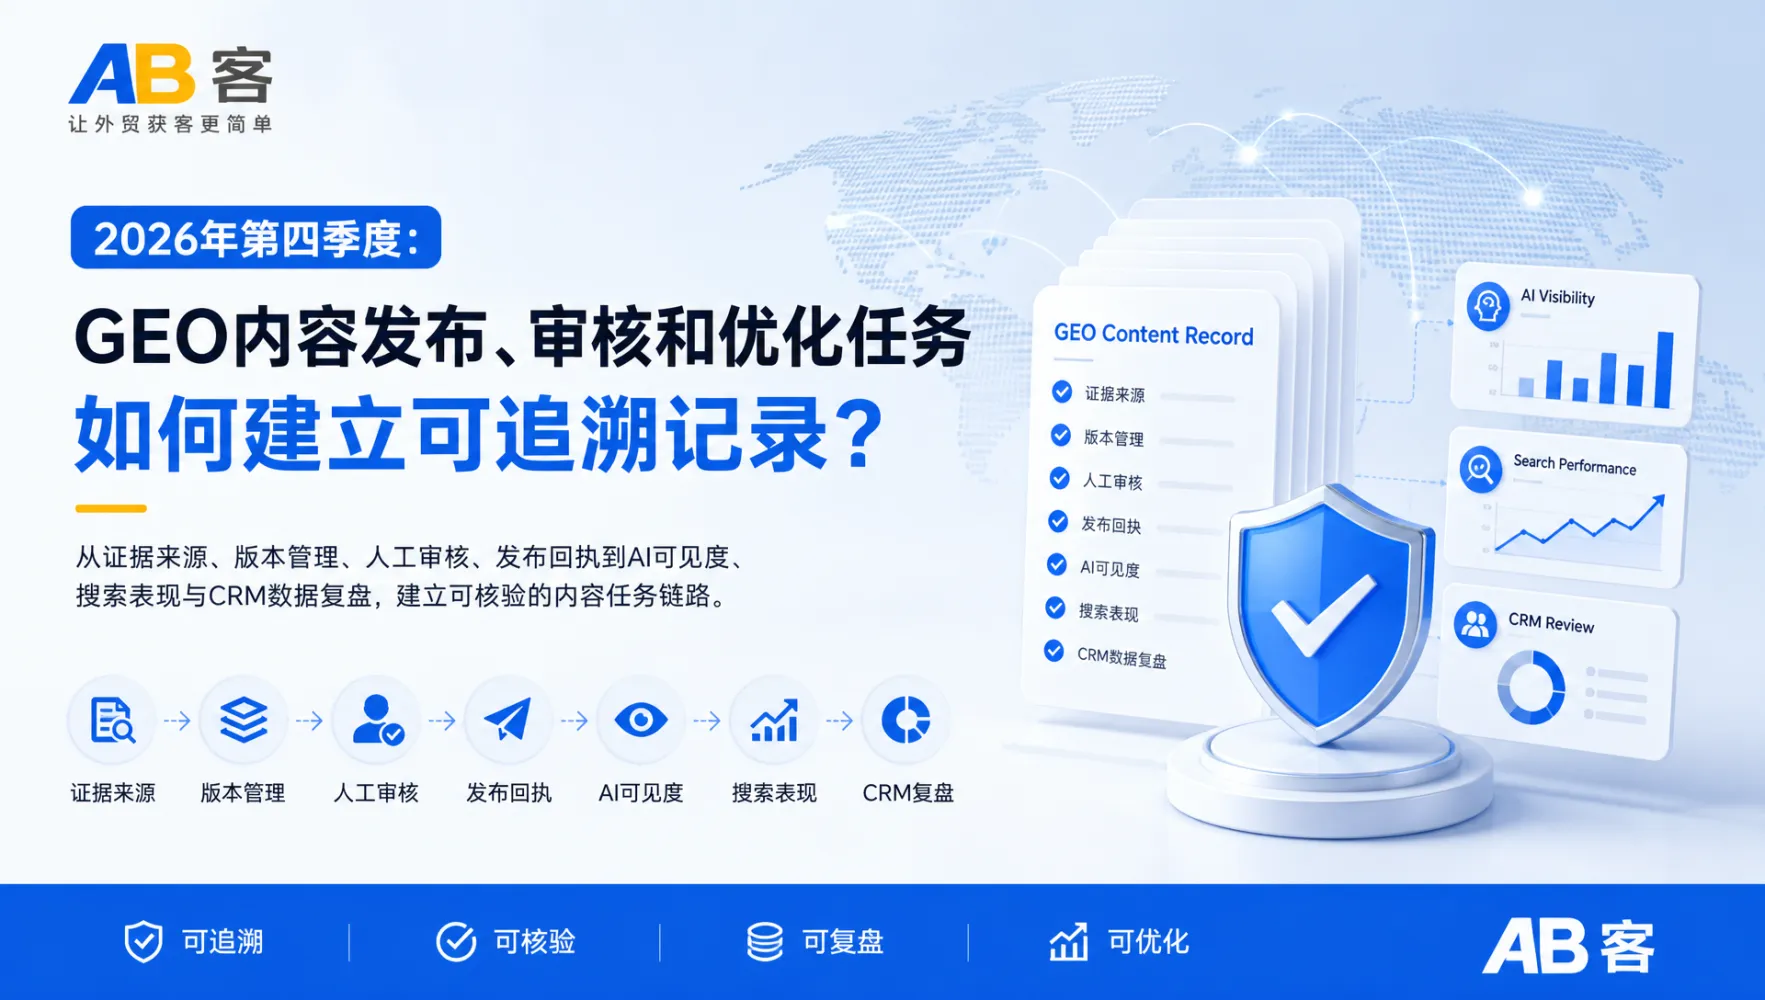
ABKE explains how to design a Q4 2026 GEO evaluation dashboard and management report template that connects evidence quality, AI visibility, website performance, inquiries, and CRM opportunity data with clear attribution boundaries.
A GEO program should be evaluated as a connected business system—not as a single count of pages, rankings, AI mentions, or inquiries. For Q4 2026 planning and review, management needs a dashboard that shows how enterprise evidence, content execution, AI visibility, website activity, and CRM opportunities relate to one another while preserving clear attribution boundaries.
This framework is designed for export B2B companies that need a practical management report: one that makes progress visible, identifies operational risks, and helps teams decide where the next stage of resources should go.
Start with a multi-stage GEO measurement model
GEO performance develops across stages. Strong downstream results usually depend on earlier work being complete, accurate, and consistently maintained. A useful Q4 2026 dashboard therefore separates leading indicators—the assets and signals the company can directly build—from lagging indicators such as qualified inquiries and CRM opportunities, which are also influenced by market demand, competition, sales follow-up, and other external factors.
- Evidence readiness: whether the company’s product, capability, trust, and solution information is structured, current, and supportable.
- Content and page coverage: whether priority buyer questions have reliable pages and content assets across relevant languages and markets.
- Search and AI visibility: whether the company appears accurately in relevant search, citation, and recommendation contexts.
- Website engagement and inquiry capture: whether visitors reach useful pages and can take clear next actions.
- CRM opportunity and sales feedback: whether inquiries are recorded, qualified, followed up, and returned to the growth system as learning signals.
The Q4 2026 GEO evaluation dashboard structure
Use one management dashboard with five connected layers. Each layer should show the reporting period, comparison period, data source, owner, interpretation, and the action required. This avoids reporting isolated metrics without operational context.
| Dashboard layer | What management should review | Typical evidence or data source |
|---|---|---|
| 1. Knowledge and evidence quality | Coverage, accuracy, approval status, update status, and traceability of enterprise and product facts. | Enterprise knowledge base, product files, certifications, case materials, approval records. |
| 2. Content and website delivery | Priority question coverage, page publication, language coverage, technical readiness, and content refresh status. | Content plan, page inventory, publishing records, website checks, structured data records. |
| 3. Search and AI visibility | Coverage of priority search topics and GEO questions; observed AI mentions, citations, recommendation appearances, and answer accuracy. | Search performance data, AI visibility monitoring, prompt test records, page indexing records. |
| 4. Website and inquiry signals | Relevant visits, priority-page engagement, form submissions, contact clicks, downloads, and inquiry quality. | Website analytics, form records, WhatsApp or email click records, inquiry intake data. |
| 5. CRM and opportunity feedback | Lead source completeness, qualification, follow-up status, opportunity stage, lost reasons, and sales feedback. | CRM, sales activity records, opportunity pipeline, feedback from sales and product teams. |
Define evidence quality before evaluating AI visibility
AI visibility is more meaningful when the underlying enterprise information is trustworthy and well governed. Before a Q4 review, define what counts as an approved evidence asset. This gives management a clear basis for assessing whether content and AI outputs reflect real business capabilities.
- Completeness: key product, manufacturing, service, application, and delivery information is available for priority markets.
- Accuracy: statements align with current enterprise facts, technical materials, and approved commercial boundaries.
- Traceability: important claims can be linked to an internal source, document, certification, case material, or responsible reviewer.
- Consistency: brand, product, and capability descriptions do not conflict across pages, languages, channels, and sales materials.
- Freshness: changed products, market priorities, certifications, and service conditions are reviewed and updated on a defined cadence.
Recommended KPI template for the management report
The template below focuses on measurement categories rather than fixed performance targets. Each company should set baselines and targets according to its product maturity, market scope, historical data, and sales cycle.
| Metric group | Suggested Q4 reporting fields | Management interpretation | Next action if weak |
|---|---|---|---|
| Evidence quality | Priority products with approved knowledge; missing evidence items; outdated materials; review completion. | Indicates whether the system has a reliable factual foundation. | Collect missing materials, clarify ownership, and complete expert review. |
| GEO content coverage | Priority buyer questions mapped; published pages; language and market coverage; refresh backlog. | Shows whether the company is answering relevant buyer and AI-query needs. | Prioritize high-value question gaps and improve weak decision-support pages. |
| AI visibility | Observed mention rate; citation rate; recommendation appearance; answer accuracy; priority-question coverage. | Shows observed presence and quality in defined AI-query tests, not a guaranteed platform outcome. | Check evidence gaps, improve semantic clarity, expand supporting content, and monitor changes over time. |
| Search and website performance | Indexed pages; keyword and topic coverage; organic visits; country sources; priority-page engagement. | Indicates whether discoverability is translating into relevant site activity. | Review page intent, technical accessibility, internal links, localization, and calls to action. |
| Inquiry and CRM quality | Inquiries by source; valid inquiry rate; response status; qualified leads; opportunity stages; lost reasons. | Connects growth activity to commercial follow-up and reveals data gaps. | Standardize source capture, strengthen lead qualification, and return sales insights to content and market planning. |
Build the report around questions management can act on
A management report should not simply list metrics. It should explain what changed, why the change may have occurred, what remains uncertain, and what decision is requested. The following report sections make the Q4 review easier to scan and use.
1. Executive operating view
State the reporting scope, priority products, target markets, main Q4 changes, key risks, and the decisions or resources required for the next period.
2. Stage-by-stage scorecard
Present evidence, content, visibility, website, and CRM indicators together so that teams can locate the weakest stage in the operating chain.
3. Market and product analysis
Compare performance by product line, market, buyer-question theme, language, and channel when the available data supports that view.
4. Opportunity feedback
Review inquiry quality, CRM completeness, common customer questions, objections, and lost reasons that should inform the next content cycle.
5. Prioritized next-stage plan
Assign a clear owner, expected output, review date, and measurement method for each priority instead of ending with general recommendations.
Use attribution language with discipline
GEO measurement can reveal meaningful relationships across knowledge quality, content availability, AI visibility, traffic, and commercial activity. However, management reporting should distinguish between observed correlation, recorded source attribution, and confirmed commercial contribution.
- Observed correlation: for example, an increase in AI mentions appears during the same period as broader evidence-backed content coverage.
- Recorded attribution: an inquiry is associated with a known landing page, channel, campaign parameter, or self-reported source in the CRM.
- Confirmed contribution: sales feedback establishes that specific content, website interactions, or brand visibility contributed to an opportunity evaluation process.
- Unknown or mixed influence: the buyer may have encountered several touchpoints, used private research channels, or entered through an untracked path.
This distinction protects report credibility. It also helps teams improve source capture, CRM discipline, and feedback loops rather than making unsupported claims about direct causality.
A practical monthly and quarterly reporting cadence
For Q4 2026, use monthly operating reviews and one quarterly management review. Monthly reporting supports execution; the quarterly report supports resource allocation and strategic decisions.
- Validate data: confirm date ranges, market scope, product scope, source definitions, and any known gaps in analytics or CRM records.
- Review leading indicators first: check evidence completeness, publication progress, language coverage, and technical website readiness.
- Assess visibility quality: evaluate priority AI questions and search topics for appearance, accuracy, relevance, and consistency—not only raw counts.
- Connect to commercial signals: examine visits, inquiry paths, lead quality, sales response, and opportunity feedback.
- Set next actions: identify the highest-impact gaps, confirm owners, and document what will be measured in the next review cycle.
Operational roles for a reliable dashboard
A dashboard is only as reliable as the operating process behind it. Responsibility should be distributed across the people who own facts, execution, and commercial feedback.
| Role | Primary responsibility | Key review question |
|---|---|---|
| Business or product expert | Validates product facts, technical claims, applications, and commercial boundaries. | Is the knowledge foundation accurate and current? |
| Marketing or GEO operator | Manages content plans, pages, channels, visibility monitoring, and optimization tasks. | Which gaps are limiting discoverability and understanding? |
| Website or data owner | Maintains tracking quality, website accessibility, data definitions, and reporting consistency. | Can this metric be trusted and compared over time? |
| Sales or CRM owner | Records source data, qualification, follow-up, opportunity progress, and buyer feedback. | Which inquiries are commercially relevant, and what did buyers need? |
| Management sponsor | Approves priorities, resolves cross-team dependencies, and allocates resources. | What should the company strengthen in the next stage? |
Connect reporting to continuous GEO operations
ABKE GEO Growth Engine supports this multi-stage approach by connecting enterprise knowledge and evidence assets, content and page records, AI citation and recommendation monitoring, website activity, inquiries, CRM opportunities, and sales feedback in a unified operating workflow.
For export B2B teams, the objective is not to treat AI visibility as an isolated campaign metric. The objective is to build a traceable system in which product knowledge informs content, content supports discoverability, discoverability creates measurable customer interactions, and sales feedback improves the next cycle of knowledge, pages, and market priorities.
A credible GEO management report makes both progress and uncertainty visible: what has been built, what has been observed, what can be attributed, what remains unproven, and what the organization should do next.


