Hot Products





Popular articles
Machinery and equipment exports to the EU in 2027: What delivery changes will the new machinery regulations bring?
How to effectively implement "multiple information sources"? A 90-day AI content creation checklist for B2B foreign trade, bidding farewell to the monotonous "ranking/evaluation of top suppliers".
Customers see AI answers before consulting; how can we record multi-channel touchpoints and keep unknown aspects as unknown?
Authoritative Outlook: Which Industries Will Drive Global Trade Growth in 2027?
Recommended Reading





QIE GROUP Overseas Website and SEO & GEO Project Case Study: Grain and Oil Processing Equipment and EPC Engineering Solutions - Phased Construction and Operation Observation
This article provides a detailed overview of QIE GROUP’s international website development, SEO and GEO services, and inquiry handling process. As of November 13, 2026, backend records showed 1,319 pages indexed by Google and 55 inquiries received in total. Screenshots and tables illustrate the results achieved to date and explain the reporting methodology.
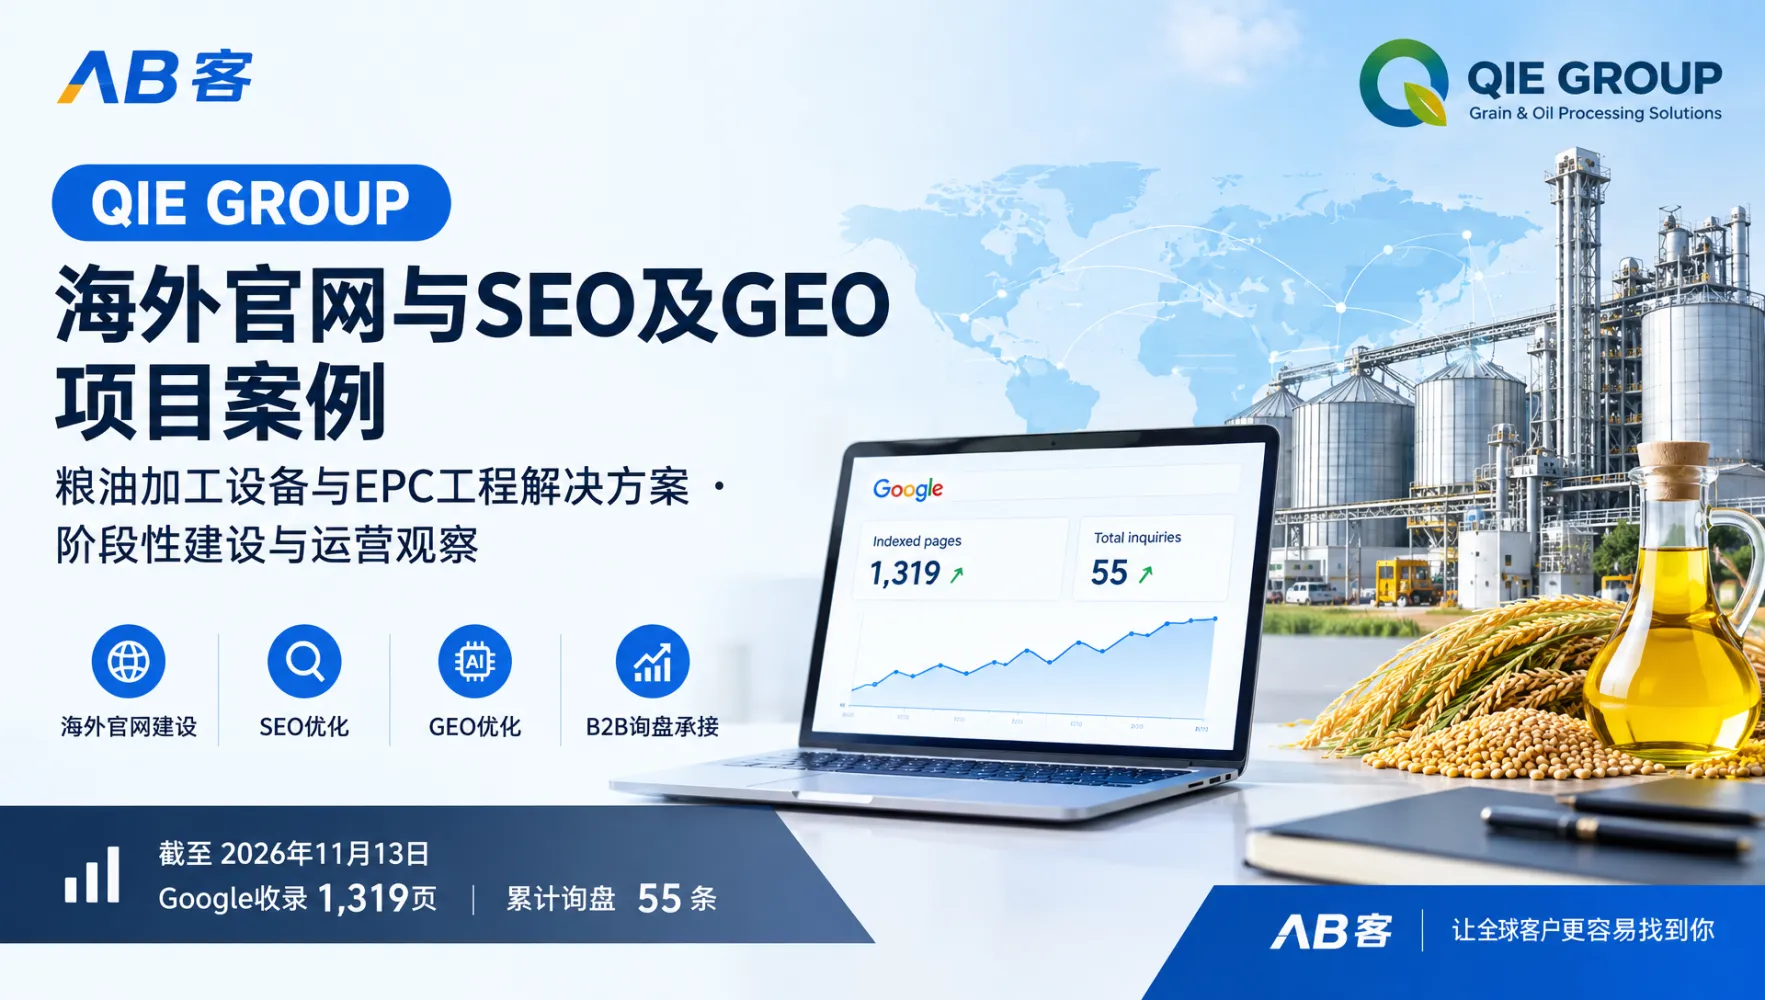
Grain and oil processing equipment · EPC projectSolution| AB customer ABKE RealClient Cases
Website launched: June 29, 2026 | Data snapshot: November 13, 2026
Project website:https://www.qiemachinery.com/
Henan Qiyi Grain and Oil Engineering Technology Co., Ltd. (QIE GROUP), throughAB customerintegrated website, search engine optimization (SEO), and generative engine optimization (GEO) services to build a content and inquiry-handling system for overseas buyers. Existing monitoring records show that the project has established a way to track Google indexing, visibility in AI-generated answers, website citations, and website inquiries. Sales revenue, orders, and return on investment still need to be assessed against business data.
1. Client Overview
Client type:An engineering-focused B2B company serving overseas markets with grain and oil processing equipment and EPC solutions. Its EPC services cover solution design, equipment configuration, installation, and commissioning. Procurement assessments typically consider both individual equipment and overall project capabilities.
Industry:Grain and oil processing machinery and engineering technology services. Products and content focus on oilseed applications, processing technologies, and project delivery.
Target market:Overseas procurement markets worldwide. The project uses a multilingual website to address demand across markets, with six languages implemented. Regional priorities, traffic, and inquiry contributions need to be analyzed by country.
Existing channels:A legacy template-based website and paid Google advertising. Existing statistics do not yet allow a quantitative comparison of advertising spend, cost per paid click, cost per qualified inquiry, or contribution to orders across the original channels.
Pain points:A product catalog cannot fully communicate suitable oil-bearing raw materials, capacity requirements, process routes, and engineering delivery capabilities; fragmented product, application, andFAQcontent needs to be organized consistently. Visibility across search and AI entry points requires ongoing monitoring, and a traceable link between visits and inquiries needs to be established. These issues indicate a need to develop the content and measurement systems; they do not, on their own, demonstrate that the original advertising was inefficient.
Client objectives:Build an official website that supports overseas purchasing decisions, expand multilingual and procurement-oriented content, add company facts that search engines and AI can recognize, and track consultation requests and inquiries. Acceptance should consider implementation completeness, visibility, and qualified opportunities rather than using a single system score as a substitute for business results.
2. Project Assessment and Solution Selection
Website baseline:The existing website already served as a company showcase and a landing destination for Google paid advertising. A system assessment on October 21, 2026 listed a reference value of 274 pages for the old website and an overall reference score of 48.2. These figures can be used to compare content scale and system assessments, but cannot substitute for actual traffic, paid advertising performance, or sales results.
Market opportunity:Grain and oil engineering procurement involves raw materials, processes,Application scenariosand delivery terms, making structured pages and technical Q&A suitable for addressing specific requirements. The project has organized content around 12 categories of oil-bearing raw material applications and six major processing modules, and developed 382GEO testingquestions. This indicates that there are content topics worth developing; it does not mean that market size or the commercial value of all keywords has been measured.
Challenges:Technical content must be accurate and consistent across language versions. Product, process, and engineering solution pages must address procurement questions. SEO rankings, AI mentions, official website citations, and sales opportunities use different units of measurement. Inquiries from advertising, organic search, and other sources also require further attribution.
Table 1. Main Development Options and Their Fit for This Project
| Development option | Primary issue addressed | Assessment for this project |
|---|---|---|
| Website redesign | Content presentation, structure, and inquiry entry points | A foundational element that needs to be combined with content governance and monitoring |
| Google paid advertising optimization | Paid traffic acquisition and landing-page conversion | Can be evaluated further; existing data is insufficient to assess cost efficiency |
| Integrated website, SEO, and GEO | Coverage of procurement-related content, search andAI Visibility, inquiry tracking | Fits the project's multilingual, engineering procurement, and measurement requirements |
Selection conclusion:Based on service delivery and monitoring records, the project focused on using the website as the content platform, supported by company knowledge governance, SEO, GEO, and conversion tracking. This approach addresses both how to present technical capabilities and how to respond to procurement needs. It does not rank the effectiveness of all channels or imply that integrated services can replace paid advertising.
To assess whether the approach is effective going forward, countries, products, and source channels should be used as common dimensions for comparing qualified inquiries,Sales follow-upand closed deals. Observing only the number of indexed pages, system scores, or request counts is insufficient to assess return on investment.
3. Service Provider's Delivery Plan
AB customer's delivery covered company fact consolidation, a multilingual website, procurement-oriented content, SEO and GEO monitoring, and inquiry tracking. The website presents business information, the knowledge and content system answers procurement questions, and the monitoring modules record performance across entry points and conversion stages.
Table 2. Delivery Modules and Observable Outputs
| Delivery module | Implementation and existing scale | Acceptance criteria |
|---|---|---|
| Company knowledge governance | Standardize descriptions of the company, products, processes, applications, and engineering capabilities | Company facts are accurate and descriptions are consistent across pages |
| Multilingual Official Website | 6 languages; 12 categories of oilseed applications; 6 major processing modules | Pages are accessible and language versions correspond to the business content |
| Procurement content | 23 product or service solutions; 5 application value scenarios; 180 FAQs | Covers product selection, application fit, and engineering assessment questions |
| Question and monitoring system | 4 customer decision dimensions; 172 anticipated customer questions; 382 GEO test questions; 13 AI testing entry points | Question sets, platforms, samples, and measurement periods are traceable |
| Conversion journey tracking | Record valid visitors, business-related browsing, consultation clicks, and inquiries | Event definitions are consistent and inquiries can be checked against sales records |
As of November 13, 2026, theCorporate Digital Personamodule score was 81.5 out of 100. This score reflects the service provider's system assessment of enterprise knowledge and content development. Counts such as 23 product or service offerings and five application value scenarios describe the scale of the content assets and cannot be directly converted into traffic or orders.
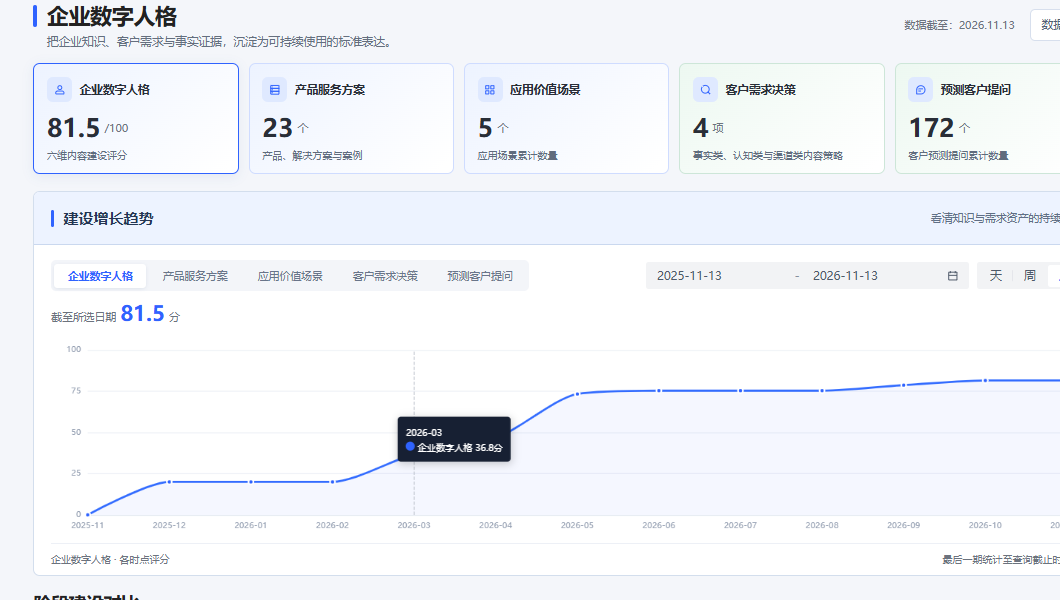
Figure 1. Selected enterprise knowledge asset dashboard metrics. Data as of November 13, 2026.
⚠️ Note the following interpretation
During implementation, the company should confirm technical parameters and engineering facts, while the service provider is responsible for content structure, page presentation, and data tracking. The 172 anticipated customer questions, 180 FAQs, and 382 test questions belong to different content or monitoring sets and cannot be added together as a total of unique questions.
4. Implementation Timeline
The project website launched on June 29, 2026. Available records include the October 21 website assessment, a 30-day conversion observation from October 14 to November 12, and module-specific data snapshots from November 12 to 13. The launch date and November 13 are 137 calendar days apart, but this does not mean that cumulative statistics for every module automatically began on the launch date.
Table 3. Verifiable Milestones and Corresponding Records
| Date | Record content | Scope of interpretation |
|---|---|---|
| Before launch Specific dates not listed |
Company fact consolidation and preparation of pages and content | Grouped by delivery module; specific duration or person-days are not inferred |
| June 29, 2026 | Project website launched | Confirms the launch milestone, not the start date of every measurement |
| October 21, 2026 | Comprehensive website assessment report | Comparison of current assessment values with old website reference values |
| October 14 to November 12, 2026 | Visits, consultations, and inquiries over the latest 30 days | A fixed observation window, not equivalent to other cumulative periods |
| November 12, 2026 | Request source data snapshot | Website-wide, search engine, and AI platform request records |
| November 13, 2026 | Knowledge asset, SEO, GEO, and cumulative inquiry snapshots | Each module is interpreted according to its own sample and definitions |
In delivery terms, company facts and business structure should be established first, followed by multilingual pages and product and engineering content, with subsequent reviews based on search performance, AI testing, and inquiry records. This summarizes the implementation relationships in this case; specific page publication batches, content update frequency, and optimization checklists for each round cannot be inferred from the available milestones.
For the next phase, a monthly review using consistent definitions is recommended: check new or updated pages, monitor priority countries and high-purchase-intent keywords, verify whether AI answers accurately describe company capabilities, and have sales validate qualified inquiries. This is an operational recommendation, not a record of completed delivery.
5. Interim Observations
Website System Assessment Comparison
On October 21, 2026, the system listed a current overall score of 89.0, 40.8 points above the old website reference score of 48.2. The page count was 1,109, compared with the reference value of 274, a difference of 835 pages. Score differences are expressed in points; website page counts and Google indexed page counts use different measurement definitions.
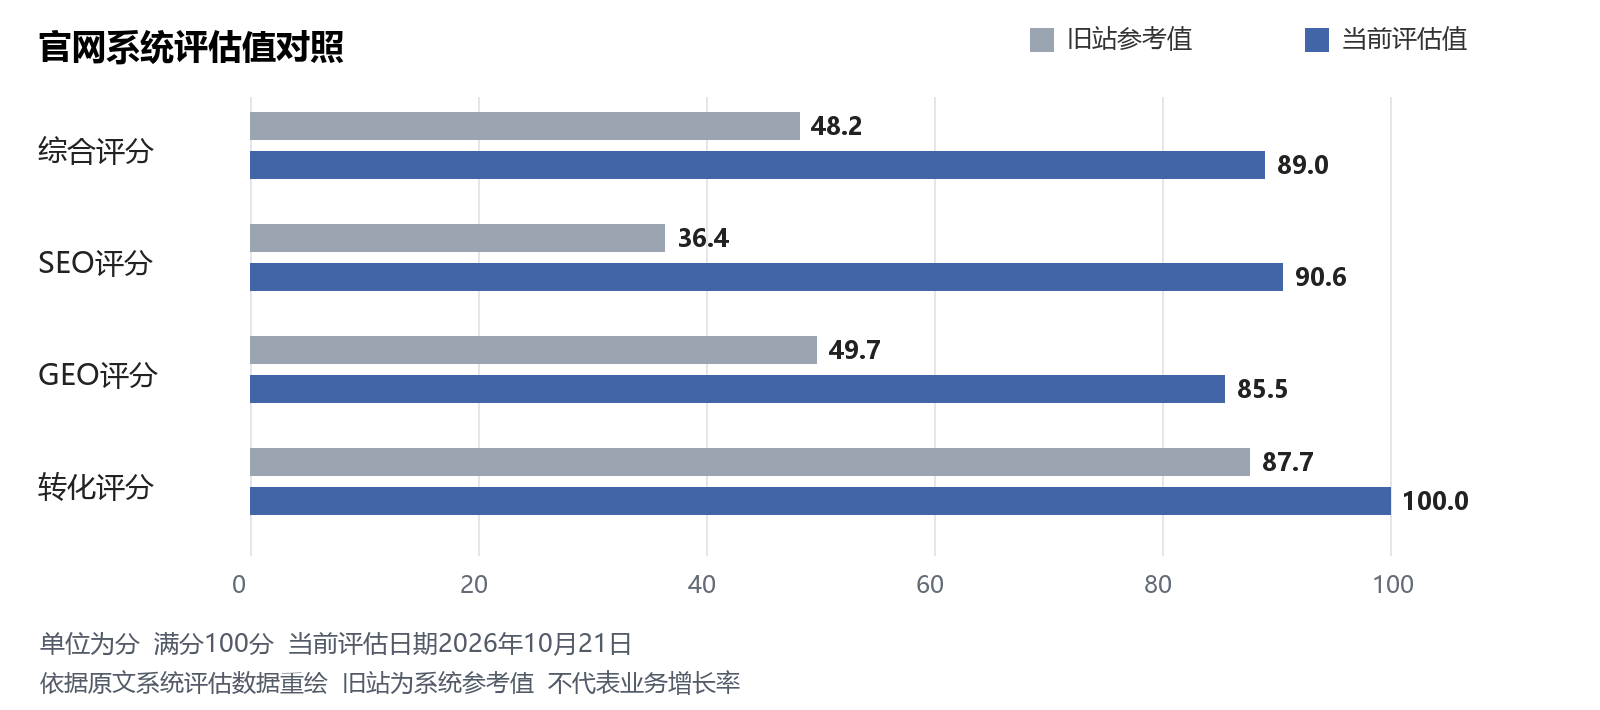
Figure 2. Old website reference values versus current assessment values; redrawn from the original system data
Table 4. Numerical Differences in Website Assessment Metrics; assessment date: October 21, 2026
| index | Old website reference value | Current assessment value | Difference |
|---|---|---|---|
| Overall score | 48.2 points | 89.0 points | +40.8 points |
| Page count | 274 pages | 1,109 pages | +835 pages |
| SEO score | 36.4 points | 90.6 points | +54.2 points |
| GEO score | 49.7 points | 85.5 points | +35.8 points |
| Conversion score | 87.7 points | 100.0 points | +12.3 points |
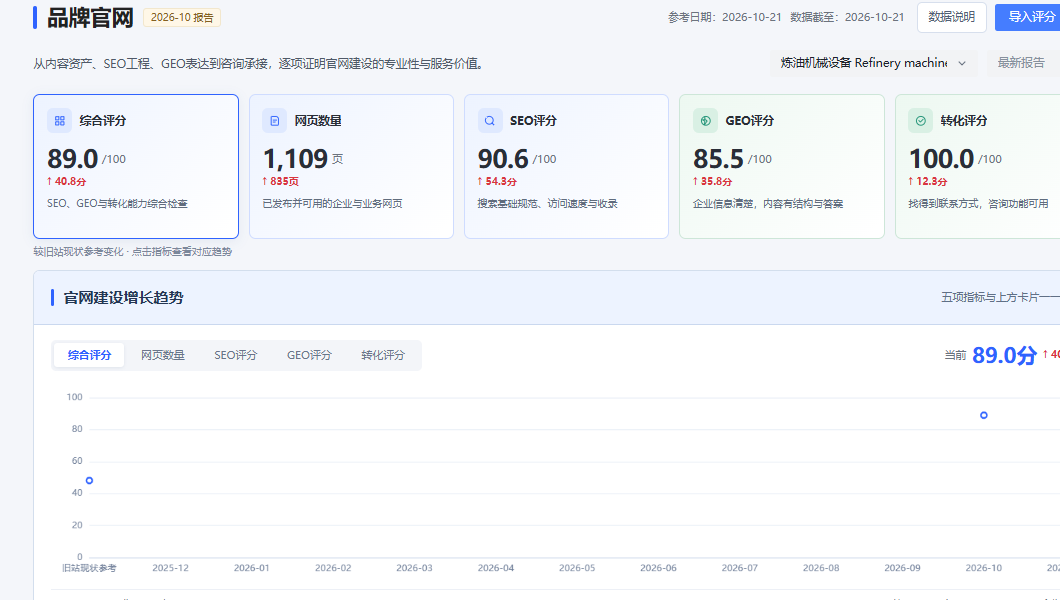
Figure 3. Excerpt of the comprehensive website assessment dashboard; current assessment date: October 21, 2026
⚠️ Note the following interpretation
The “conversion score of 100” is a system score, not a 100% visitor conversion rate. The old website reference values and current assessment values also do not constitute an independent, contemporaneous experimental comparison.
Google Indexing and Search Term Coverage
As of November 13, 2026, Google had indexed 1,319 of 1,436 pages expected to be indexed, giving an indexing rate of 91.85%; 117 pages had not been counted as indexed. Of 6,037 search terms tested, 3,357 had rankings, representing 55.61%. A total of 2,992 terms ranked in the top 20, representing 49.56% of all tested terms.
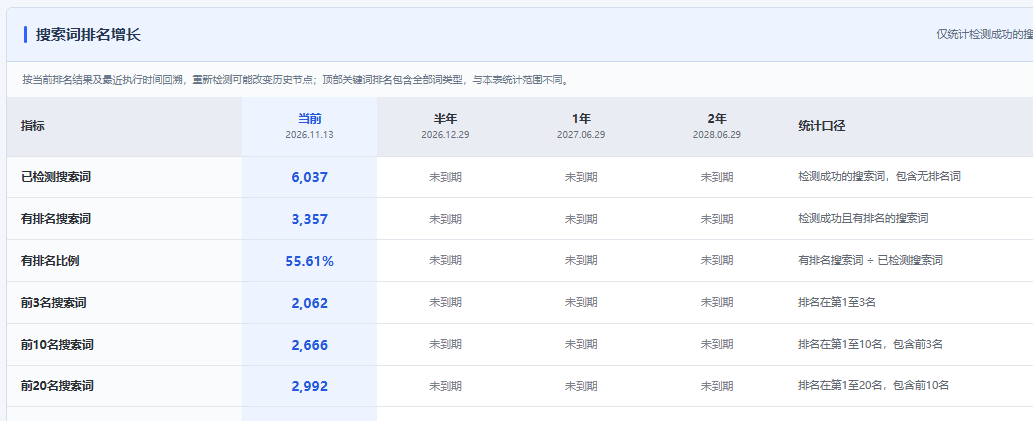
Figure 4. Excerpt of the search term ranking dashboard; current column as of November 13, 2026
Table 5. Search Coverage Results and Calculation Basis
| index | Count or result | Calculation or scope |
|---|---|---|
| Pages indexed by Google | 1,319 pages | 1,436 pages expected to be indexed; 1,319 ÷ 1,436 = 91.85% |
| Tested search terms | 6,037 items | Includes terms with and without rankings |
| Search terms with rankings | 3,357 entries | 3,357÷6,037=55.61% |
| Search terms in the top 3 | 2,062 items | 34.16% of tested terms |
| Search terms in the top 10 | 2,666 entries | 44.16% of tested terms; includes the top 3 |
| Search terms in the top 20 | 2,992 entries | 49.56% of tested terms; includes the top 10 |
⚠️ Note the following interpretation
The top 3, top 10, and top 20 categories overlap and cannot be added to calculate total coverage. Existing rankings and indexing indicate that content has entered the search ecosystem, but do not establish visitor counts, organic traffic growth, or contributions from commercial-intent terms.
Search terms should subsequently be analyzed by country, language, product, and purchase intent, and linked to clicks and qualified inquiries. Total search impressions and organic clicks were not included in this comparison of core results. The original date range selected in the relevant screenshots predates the website launch and cannot be combined with the post-launch project period.
AI Brand Visibility and Official Website Source Comparison
The GEO question set contains 382 questions; the brand comparison used 217 questions after deduplicating identical questions across platforms. QIE GROUP appeared in answers to 214 questions, a 98.6% hit rate, with a weighted visibility score of 86.8 points, ranking second in that system leaderboard. Its official website was cited for 164 questions, a 75.6% hit rate, with an overall score of 72.1 points, ranking second in that source leaderboard.
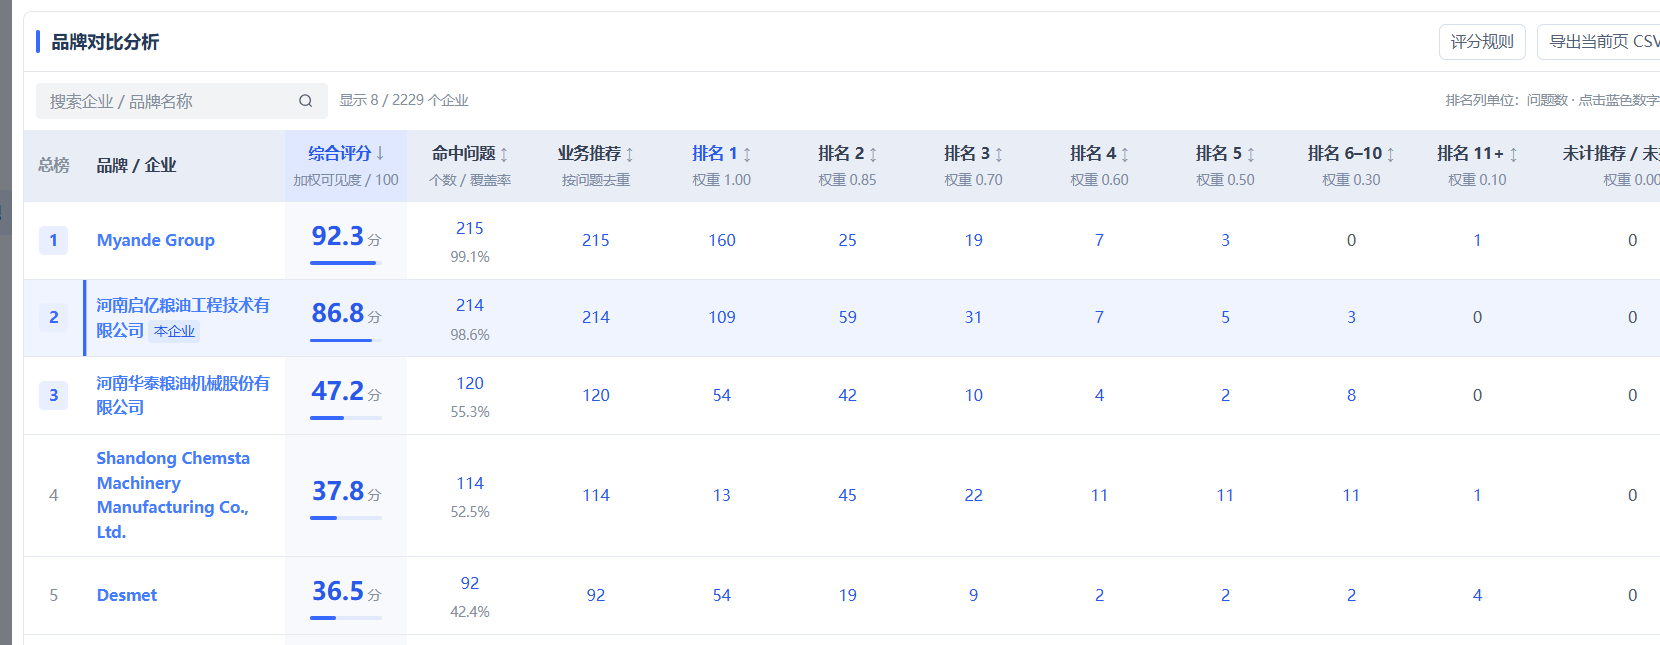 Figure 5. Excerpt of the brand comparison dashboard; the leading row and QIE GROUP row in the same test sample
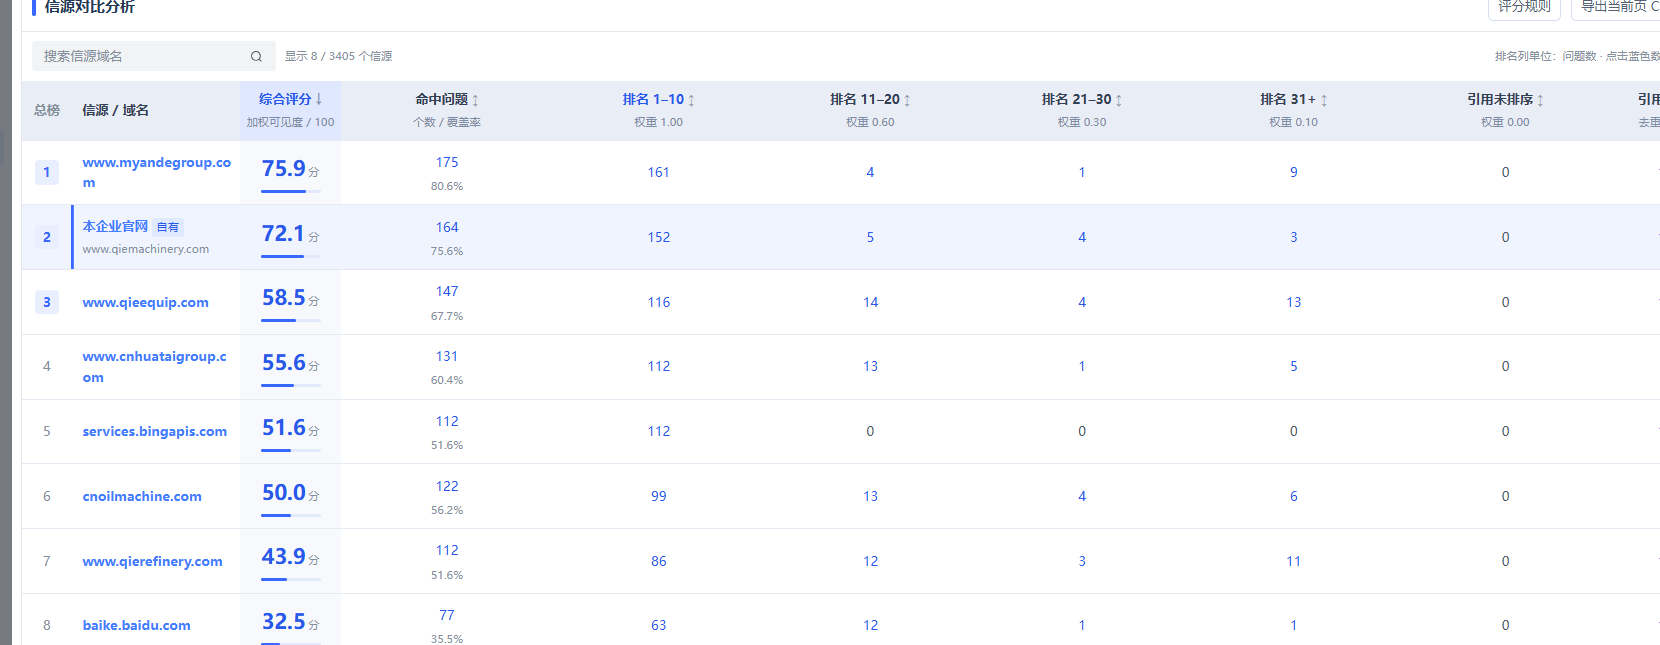
Figure 6. Excerpt of the source comparison dashboard; comparison of the leading official website and QIE GROUP's website
Table 6. Two Comparable Results from This Leaderboard; scores out of 100
| Comparison dimension | QIE GROUP | Leading comparison entity | Score difference |
|---|---|---|---|
| Brand visibility | 86.8 points; 214/217 questions 98.6% |
Myande Group 92.3 points; 215/217 questions |
−5.5 points |
| Official source | 72.1 points; 164/217 questions 75.6% |
myandegroup.com 75.9 points; 175/217 questions |
−3.8 points |
A brand hit means the brand appeared as a recommendation or mention in an answer; an official website source hit means the website appeared among the cited sources. These are different metrics. Of QIE GROUP's 214 brand hits, 109, 59, and 31 questions placed it first, second, and third respectively. Of the website's 164 hits, 152 had citation positions from 1 to 10, and 186 official website citation URLs were identified. These leaderboards represent only this sample and cannot be extrapolated to industry-wide rankings or recommendation probabilities across all AI platforms.
Search Engine and AI Platform Request Records
As of November 12, 2026, the dashboard had recorded 196,957 cumulative website-wide requests, including 22,432 search engine requests and 8,788 AI platform requests. Using all website requests as the denominator, these accounted for 11.39% and 4.46%, respectively. The unit here is requests.
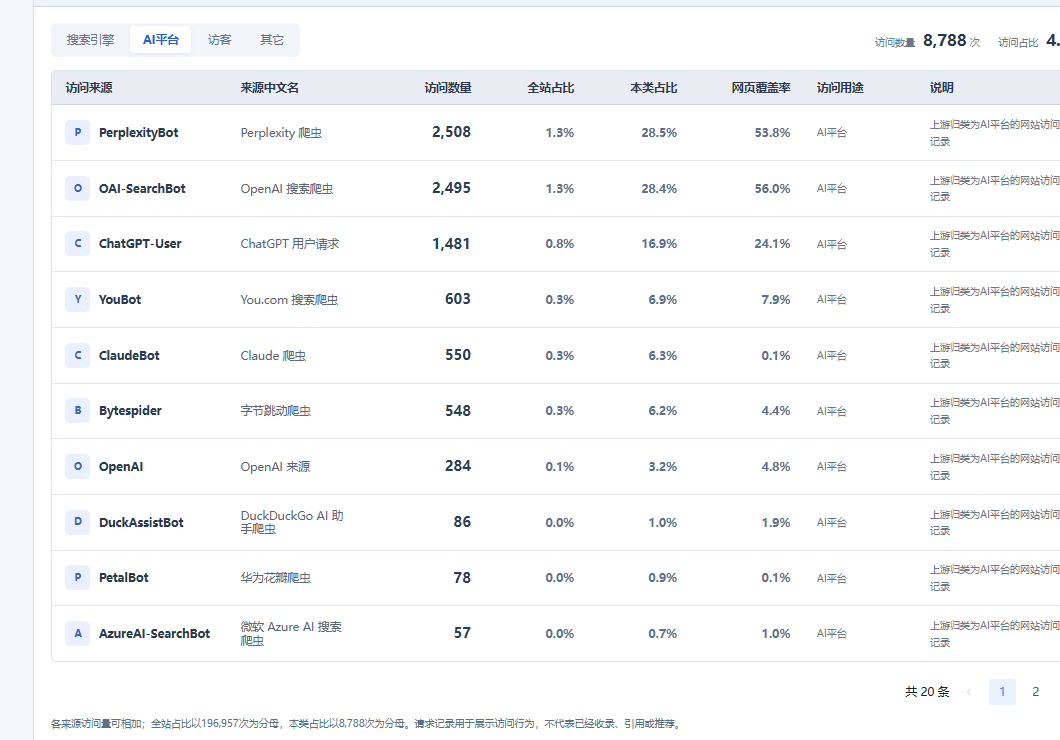
Figure 7. Excerpt of AI platform request source details; data as of November 12, 2026
Table 7. AI Request Sources and Their Share of AI Platform Requests
| Source identifier | Requests | Share of AI platform requests |
|---|---|---|
| PerplexityBot | 2,508 | 28.54% |
| OAI-SearchBot | 2,495 | 28.39% |
| ChatGPT-User | 1,481 | 16.85% |
| Total for the three sources above | 6,484 | 73.78% |
| Total AI platform requests | 8,788 | 100.00% |
Request records indicate that these sources accessed website content and can help check website accessibility to search engines and AI platforms. A single source can request pages multiple times, so request counts cannot be converted into unique visitors, AI recommendations, official website citations, or potential customers.
Access activity, brand recommendations, and official website source citations must be observed separately. Even when request volumes are high, answer records for specific questions and cited URLs must be reviewed to determine whether company information is used accurately. Commercial value requires further linkage to actual inquiries and sales follow-up.
Website Visits and Inquiry Performance
As of November 13, 2026, 55 inquiries had been recorded cumulatively. During the latest 30-day window, October 14 to November 12, 2026, the system recorded 849 valid visitors and 15 inquiries, including 10 qualified inquiries. Qualified inquiries represented 1.18% of the visitor count, and 66.67% of inquiries during the period.
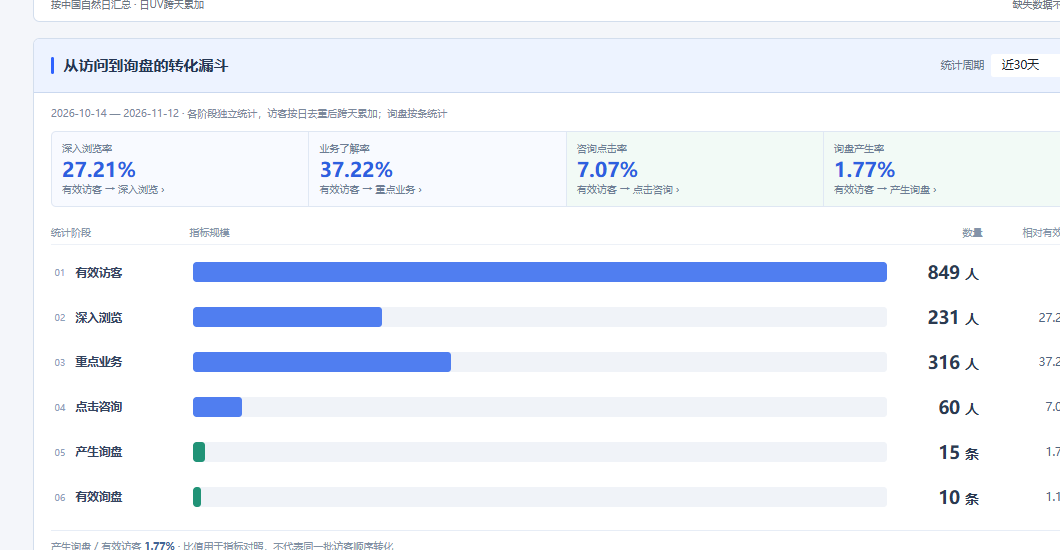
Figure 8. Latest 30-day visits and inquiries dashboard; October 14 to November 12, 2026
Table 8. Cumulative Records Compared with the Latest 30-day Records
| index | Cumulative record | Latest 30-day record | Share of latest 30-day visitor count |
|---|---|---|---|
| Valid visitors | 4,065 visitors | 849 visitors | 100.00% |
| In-depth browsing | 1,238 visitors | 231 visitors | 27.21% |
| Key business page visits | 1,375 visitors | 316 visitors | 37.22% |
| Consultation clicks | 260 clicks | 60 visitors | 7.07% |
| Inquiries generated | 55 inquiries | 15 inquiries | 1.77% |
| Valid Inquiries | Not listed | 10 inquiries | 1.18% |
⚠️ Note the following interpretation
Browsing and consultation stages are measured as independent metrics, not as a strict funnel in which the same visitors decrease at each successive stage. The 316 key business page visitors exceed the 231 in-depth browsers, so stage-to-stage conversion rates cannot be calculated from these figures. Visitors in the latest 30 days are deduplicated daily and then summed across days, not deduplicated across the entire period. Inquiry-related ratios in the table compare inquiry counts with visitor counts.
Cumulative consultations are measured in clicks, while consultations in the latest 30 days are measured in people; the two cannot be used to calculate a direct period-over-period change. Existing records cannot yet separate the contributions of advertising, organic search, or AI sources to the 55 inquiries, nor can they establish sales revenue, customer acquisition cost, or return on investment.
6. Case Summary & Industry Insights
1. An engineering-focused B2B website needs to evolve from a product catalog into an enterprise knowledge asset. In the QIE GROUP case, the website presents company positioning, processing technologies, application scenarios, solutions, project cases, technical FAQs, and a project inquiry entry point. It organizes engineering expertise into a searchable, verifiable, and continuously updatable content system.
2. SEO and GEO need to be developed together. Search term rankings, Google indexing, AI recommendations, and official website source citations should be monitored together. As of the data snapshot, QIE GROUP's interim results included a GEO weighted visibility score of 86.8/100, a 98.6% hit rate for non-brand questions, 3,357 ranked search terms, and an official website source score of 72.1/100.
3. Procurement-focused content should answer real decision-making questions. Supplier evaluation, products and services, procurement and delivery, and application fit are core concerns for engineering-focused B2B buyers. FAQs, solutions, scenarios, and engineering content should be continually developed around these questions.
4. The conversion journey must be traceable. Create a measurable journey from qualified visitors and deeper browsing to visits to key business pages, consultation clicks, and inquiries. Over the past 30 days, the ratio of qualified inquiries to qualified visitors was 1.18%; future assessment should also take into account CRM and inquiry qualityContinuous optimization.
5. Data definitions must be clear. Crawler requests are not equivalent to unique visitors, AI answer recommendations, or citations; website inquiry records are not equivalent to closed orders. Interim results do not constitute a fixed promise of future rankings, AI recommendations, citation rates, inquiry volumes, or sales performance.
7. Case Notes
Sources and background:The project entity is Henan Qiyi Grain and Oil Engineering Technology Co., Ltd., the service provider is AB Customer, and the monitoring system is GEOims. The project website is [website address missing]. https://www.qiemachinery.com/ . The existing channel, described as “an old template-based website and Google paid advertising,” is client background information. Project scale, testing, and conversion data are interpreted according to their respective modules.
Measurement periods:The comprehensive website assessment was dated October 21, 2026; request records ran through November 12; knowledge asset, SEO, GEO, and cumulative inquiry snapshots were taken as of November 13; and the latest 30-day conversion window ran from October 14 to November 12. The modules are not treated as sharing the same measurement period.
Performance note:This case presents interim project development and monitoring results and does not constitute a fixed promise of future rankings, AI recommendations, citation rates, inquiry volumes, or sales performance.


